KFMASH THERMOCALC Comparison #1
KFMASH THERMOCALC Comparison #2
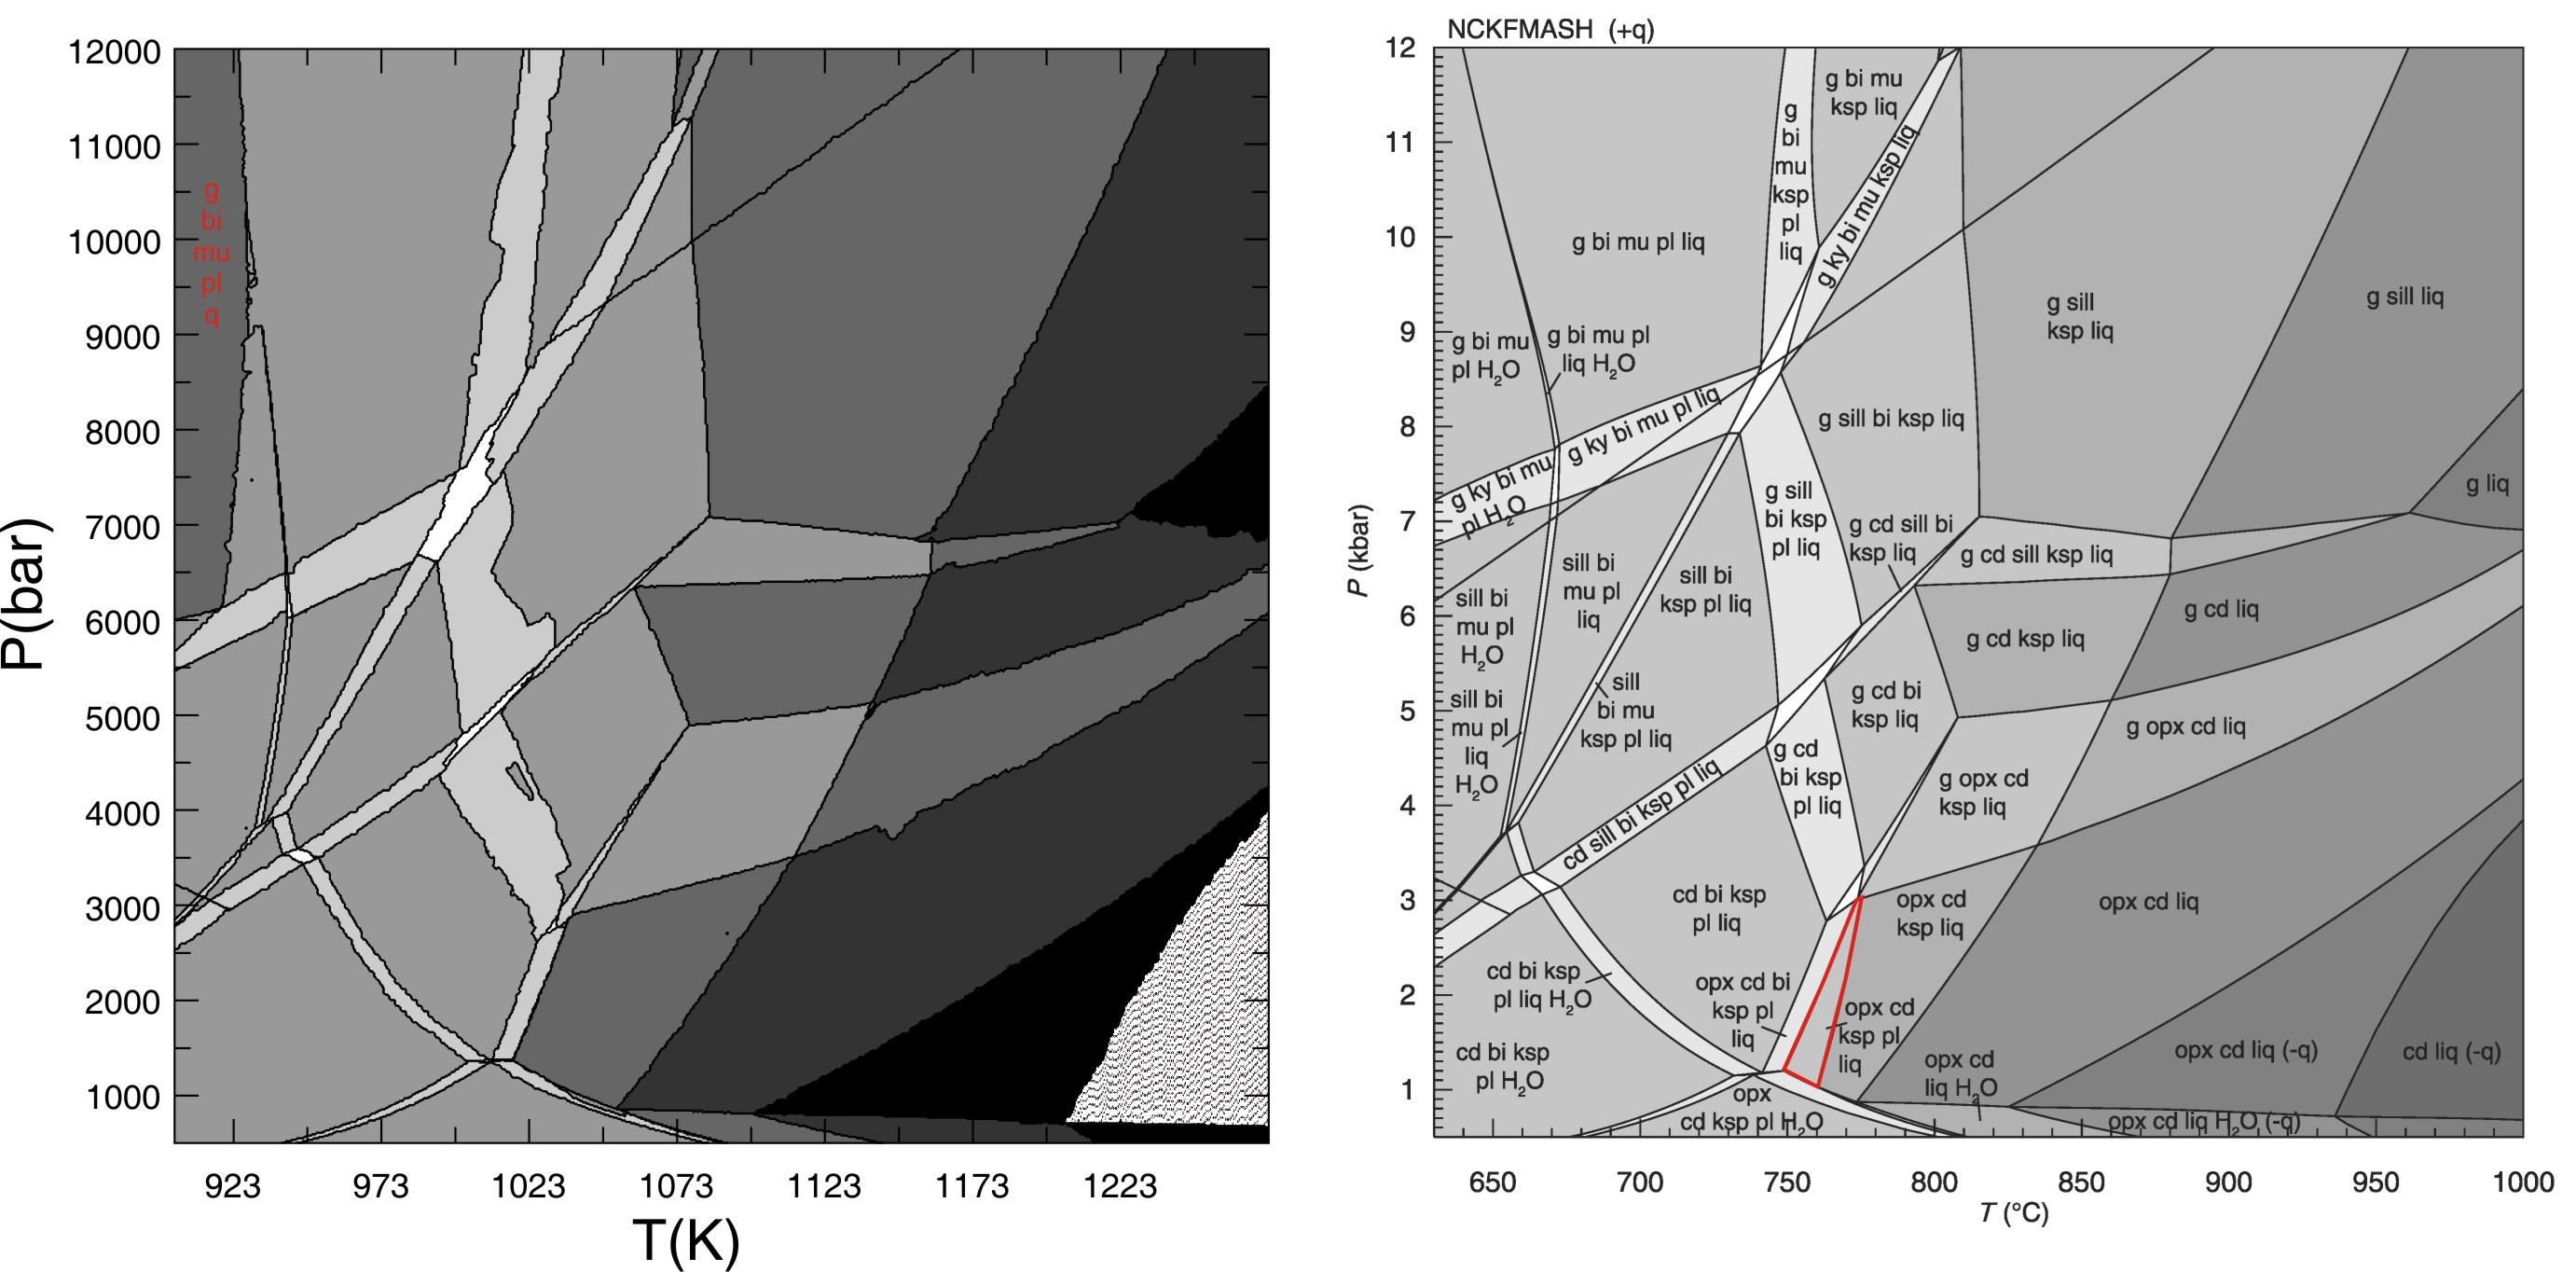
White, Powell & Holland (JMG, 2007) THERMOCALC Comparison
Stixrude & Lithgow-Bertelloni (JGR, 05) Comparison
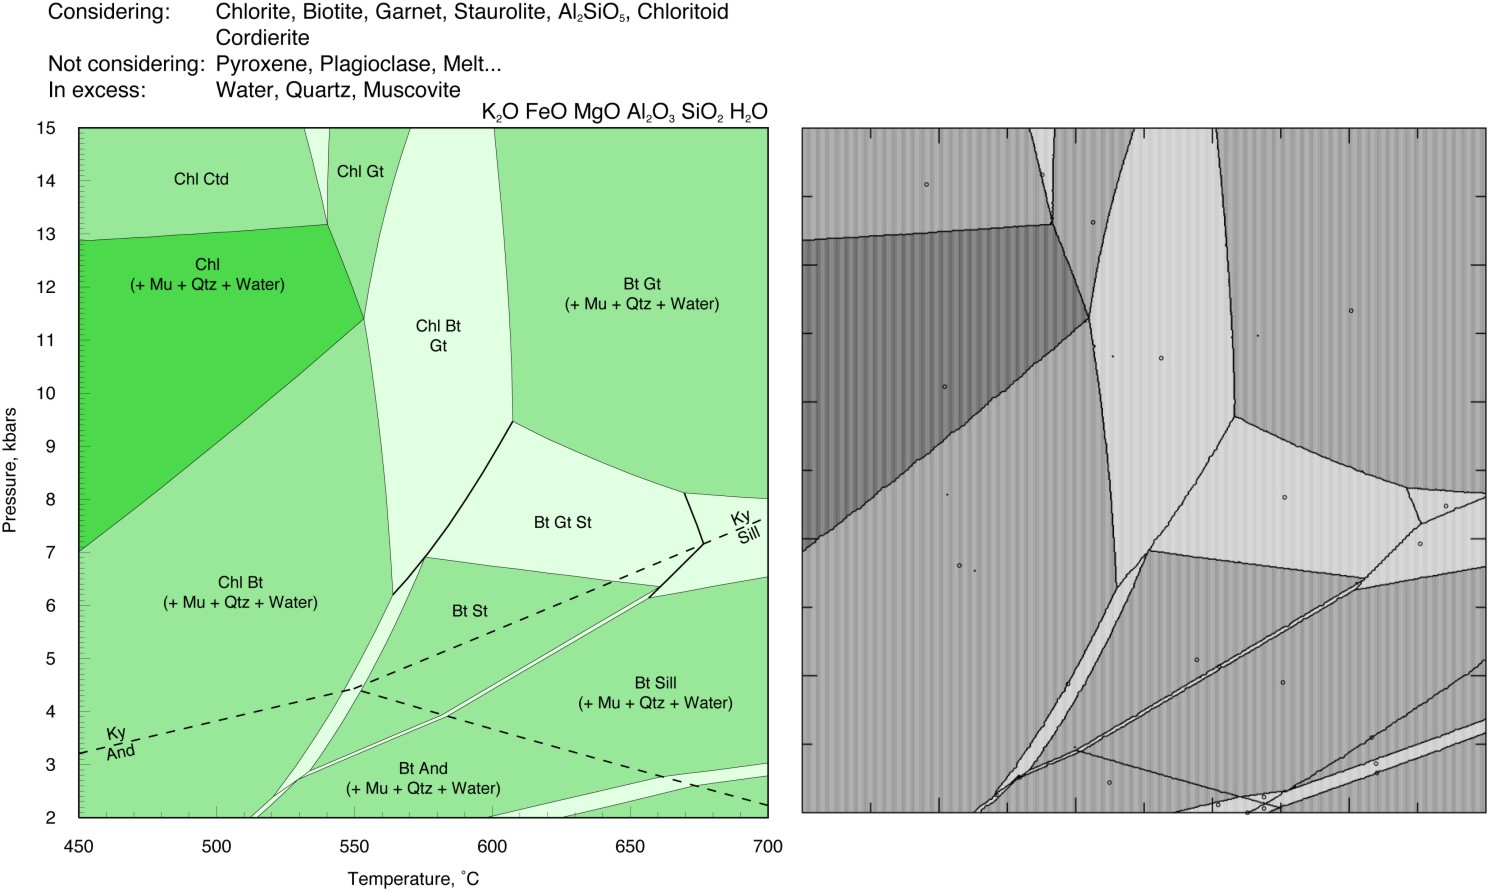
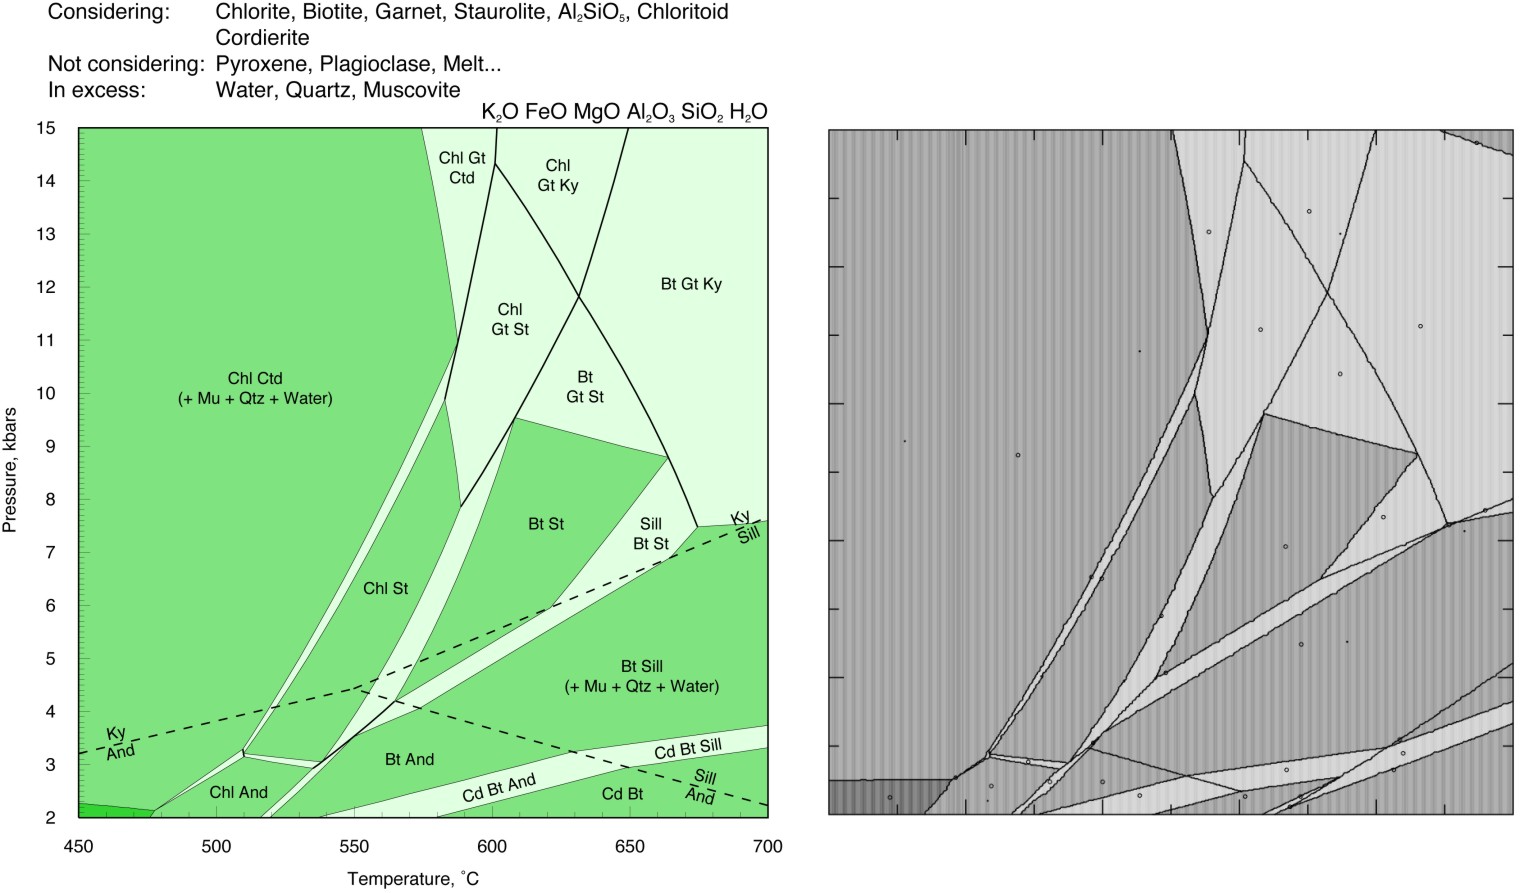
Kelsey et al. (JMG, 2004) THERMOCALC Comparison
Fe-Si alloys and liquid, Lacaze & Sundman (Metal. Trans., 1990), Perple_X vs Thermo-Calc
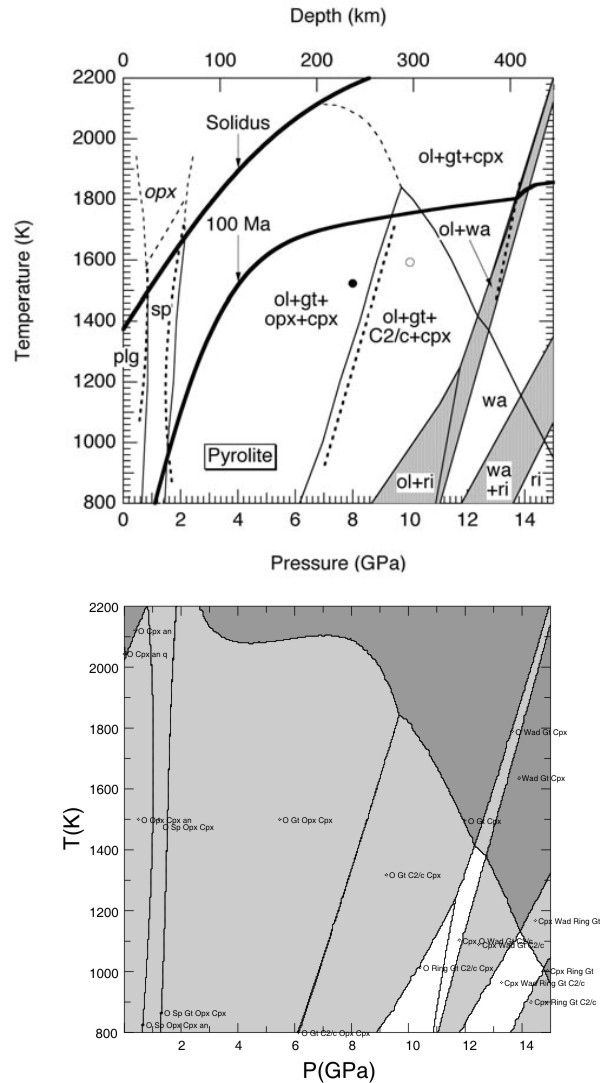
NCFMAS, whole mantle mineralogical model, Stixrude & Lithgow-Bertelloni (J Geophys Intl, 2011)
NCFMAS, mantle transition zone mineralogical model, Holland et al. (JPet, 2013)
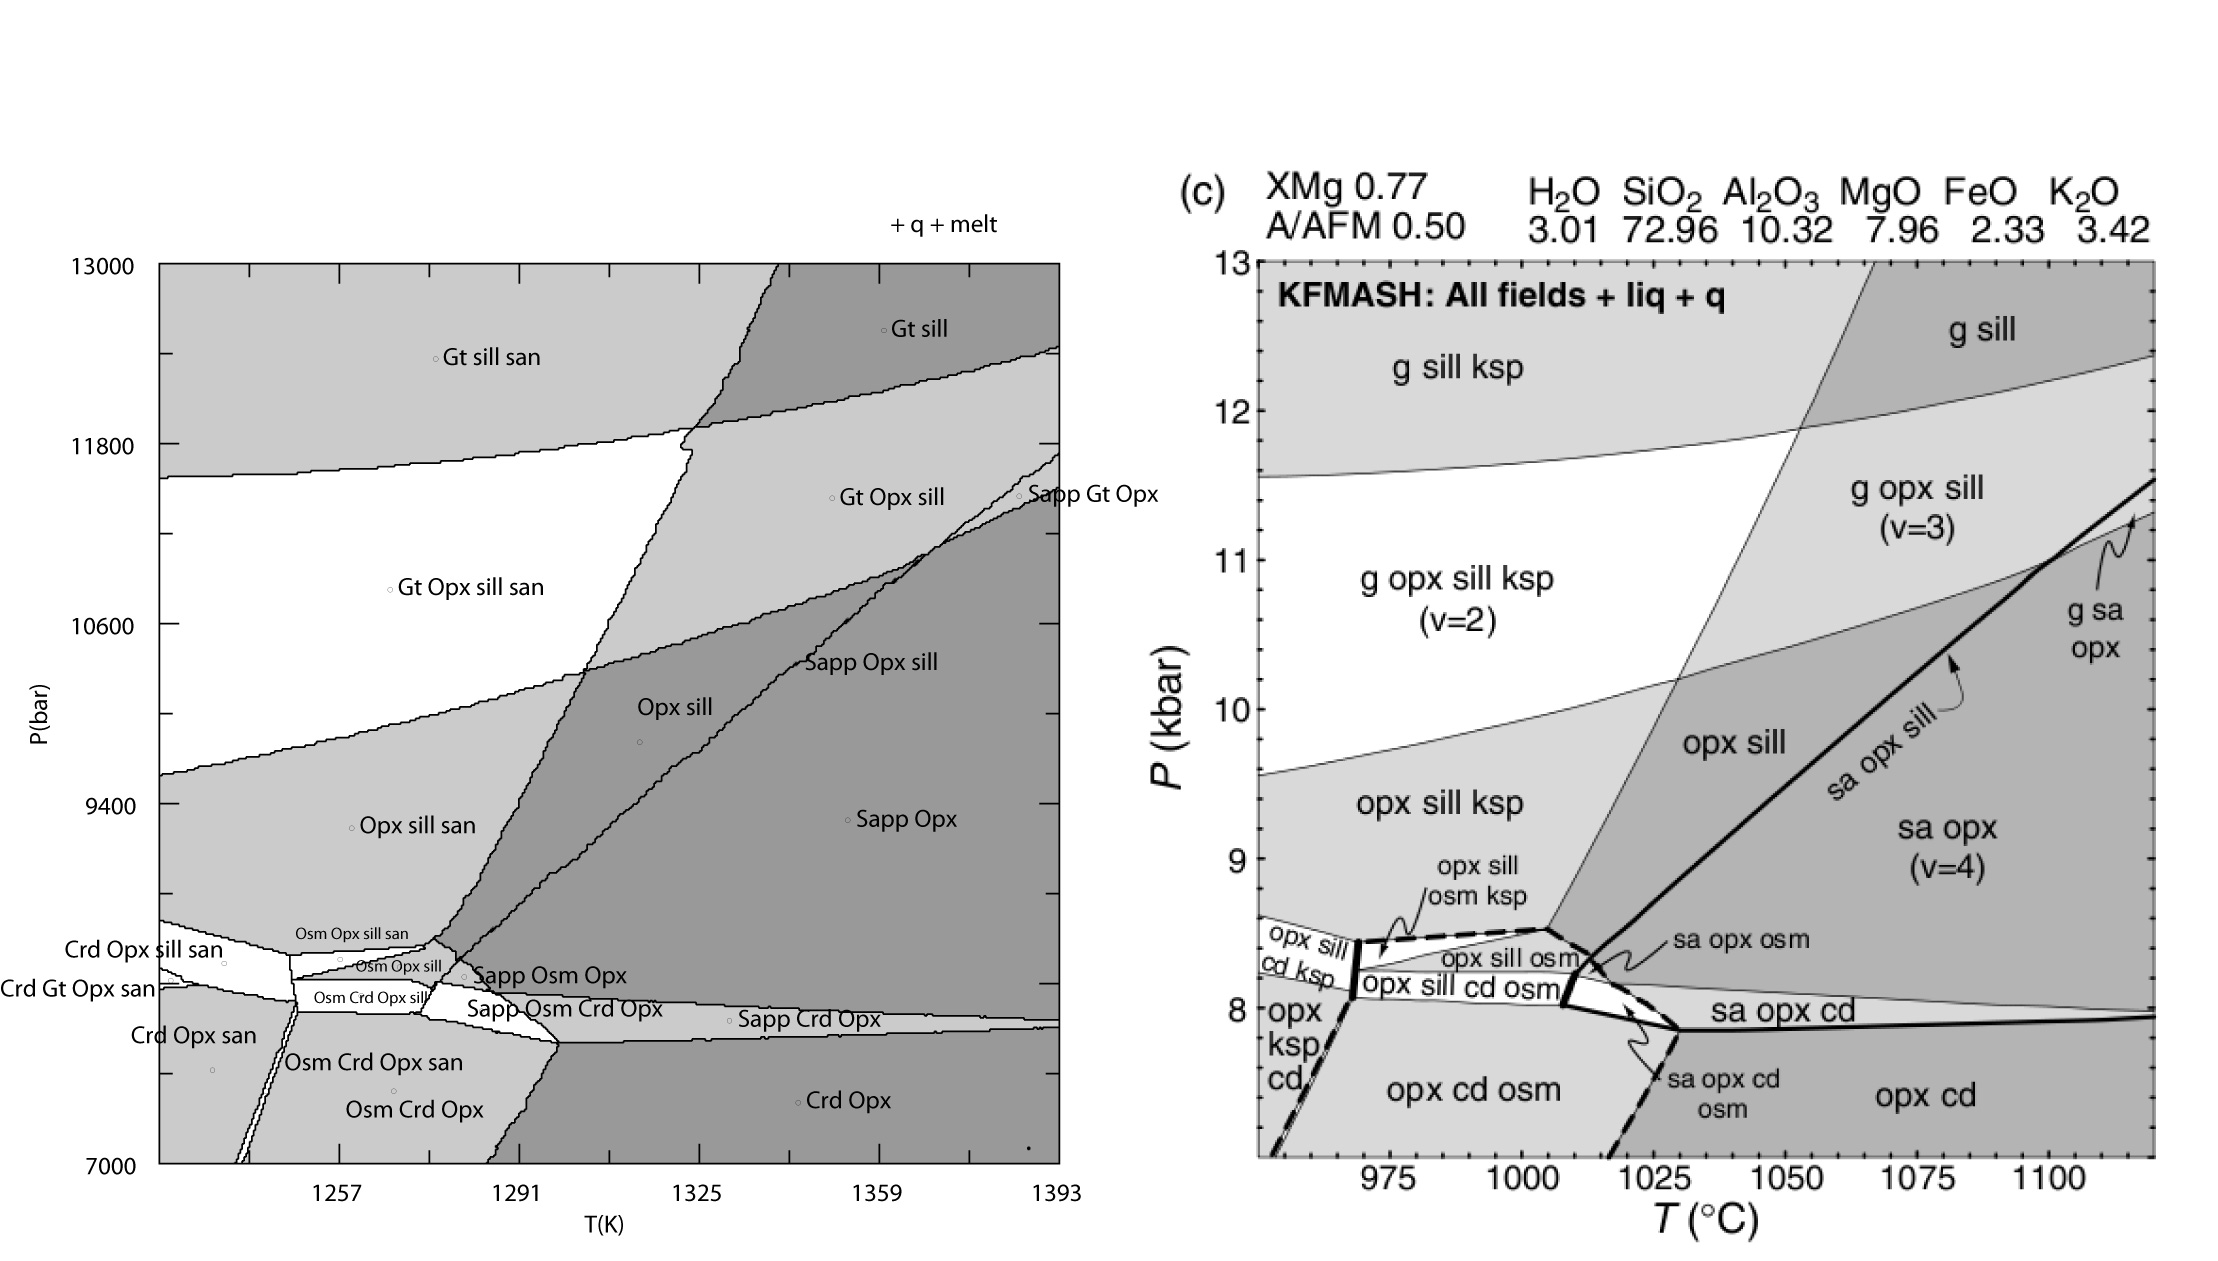
KFMASH, metapelite melting, White et al (JMG 2014)
Fe-S alloy and liquid, Saxena & Eriksson (sic, CALPHAD, 2015).
Perple_X and THERMOCALC should yield identical results for calculations from the same thermodynamic data and models, thus comparisons provide a simple means of testing whether solution models and data from THERMOCALC are implemented correctly in Perple_X. Conversely, once such comparisons verify the integrity of the Perple_X implementation, Perple_X can be used to check that phase relations computed in THERMOCALC are correct in terms of absolute stability. Unfortunately direct Perple_X and THERMOCALC comparisons are difficult to make because of the expertise required to assure that the models used as input to both programs are identical. Consequently it is often difficult to assess the origin of discrepancies between the two programs. Over the last year this difficulty has become a concern for some users because Perple_X does not implement the equipartition constraint used in many of the THERMOCALC solution models. This page shows the results of three comparisons made by Mark Caddick (ETH) to assess the importance of equipartion. The comparisons show remarkable agreement, suggesting that equipartition does not have a large influence on computed phase relations. The consistency is surprising given that the equipartition effect should be maximized for pelitic bulk compositions such as those used in the comparisons. The Perple_X calculations were made with thermodynamic data from hp02ver.dat while those for THERMOCALC were made with a more recent revision of the Holland & Powell (1998) data base in which the aluminosilicate polymorph properties have been adjusted to relocate the polymorph triple point. This adjustment accounts for most of the discrepancies between the calculations, and these could be eliminated by using the more recently revised version of the THERMOCALC data base in Perple_X (or vice versa, dependent on your beliefs).
The THERMOCALC and Perple_X input files for this comparison are here. The Perple_X calculation requires < 2 minutes of computer time (Perple_X '07).
The additional field at high temperature and low pressure in the Perple_X result is due to the breakdown of muscovite (which is assumed stable for the THERMOCALC calculation). The Perple_X calculation requires < 2 minutes of computer time (Perple_X '07).
Comparison of the THERMOCALC calculation shown in Fig 6 of White at al (JMG, 2007) with a Perple_X calculation for the same bulk composition. The solution models for all phases except feldspar should be identical. The Perple_X calculation was made with the Furman & Lindsley (1988) ternary feldspar model, the corresponding THERMOCALC feldspar models were not used because the models cannot predict the stable feldspar structural state (i.e., the structural state must be specified by the user). As there are no discrepancies in the feldspar-absent phase field boundaries, it appears probable the discrepancies between the two calculations are due entirely to the choice of the feldspar model. The prominent discrepancies (marked in red) are the absence of the ksp+pl+opx+cd+melt field in the Perple_X calculation (where the feldspar is predicted to be homogeneous) and the existence of a water under-saturated phase field at low temperature and high pressure (this phase field is suppressed if the water-content is increased by < 1 mole, the absence of the phase field in the THERMOCALC calculation is most likely due to the feldpar model, but also simply may be an oversight).
The input for the Perple_X calculations is here.
This is EXAMPLE #23 from Perple_X examples, refer to the example for the input files.
The Perple_X input files for this comparison are here. NOTE: the input files have been modified to use the Bio(TCC) model rather than the Bio(HP) model, this modification also requires appropriate make definitions in the thermodynamic data file kel04ver.dat, these definitions have been added to the Perple_X 666 version of kel04ver.dat, but they are not present in the Perple_X '07 version of kel04ver.dat.
The Perple_X calculation requires < 4 minutes of computer time (Perple_X '07).
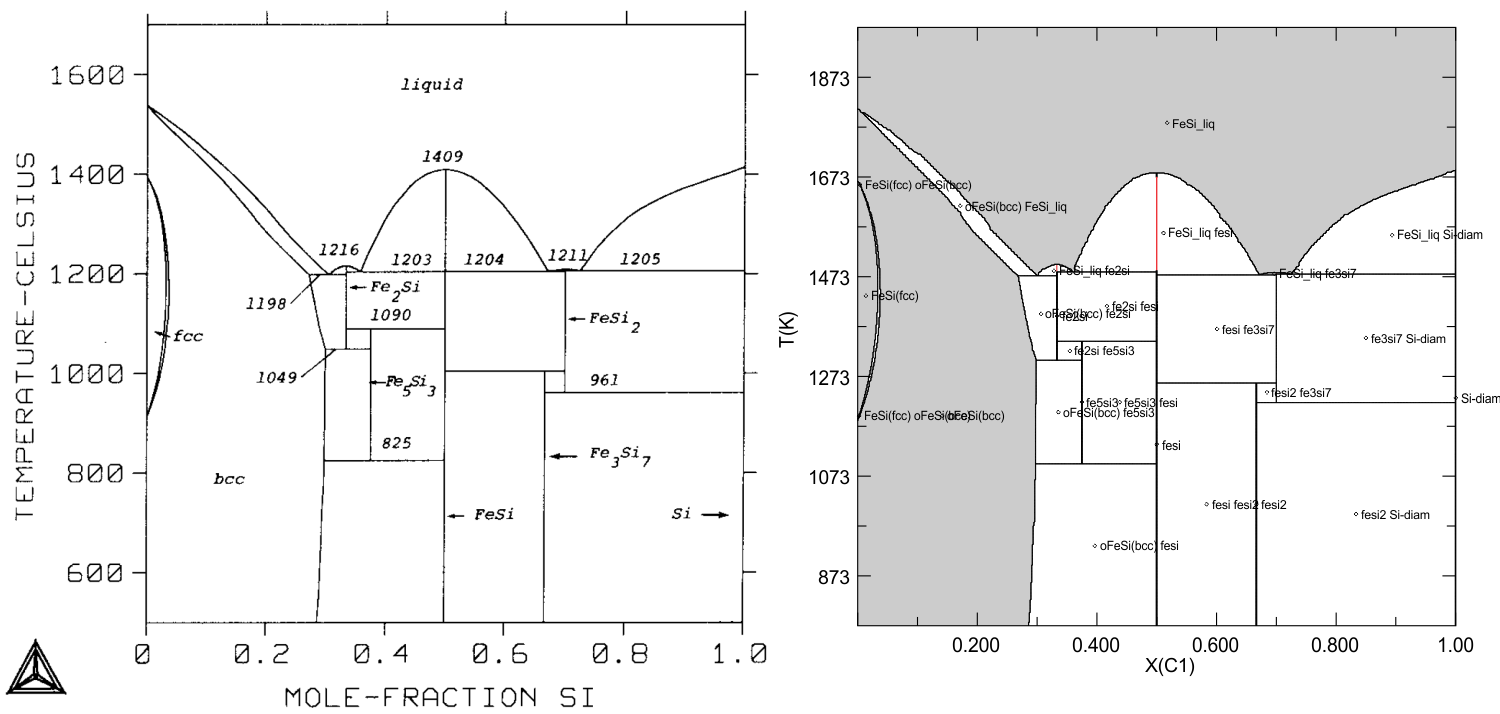
This example is the isobaric phase diagram for the Fe-Si alloy and liquid system as a function of temperature and composition (Si mole fraction) at a pressure of 1 bar. The diagram on the right (Fig 6 of Lacaze & Sundman 1990) was computed with the commercial metallurgical Thermo-Calc program (e.g., Sundman 1991), the diagram on the right was computed with Perple_X (input files for the calculation are here). The comparison reveals discrepancies on the order of a few degrees in some of the peri/eutectoidal equilibrium, presumably these discrepancies reflect minor differences between the data entered in Thermo-Calc and given by Lacaze & Sundman (1990). The graphics algorithm used in Perple_X (usually) draw the one-phase field of a stoichiometric compound if the field terminates at a singular point, these fields (drawn in red) were added manually to the computer generated plot. This graphics issue can be avoided by using "unconstrained minimization" rather than "gridded minimization" for the phase diagram calculation in VERTEX. Note that the FeSi2 and Fe3Si7 fields are labeled incorrectly in the Thermo-Calc plot.